
Identifying the queries that consume the most CPU in SQL Server is a common challenge for database administrators. High CPU usage can significantly degrade performance, making it crucial to pinpoint the responsible queries for optimization. While various DMVs and tools offer insights into query performance, Extended Events provide a powerful and flexible mechanism for detailed analysis, including historical data and specific execution details. This article will guide you through setting up an Extended Events session to effectively find high CPU usage in SQL Server, enabling you to identify and address performance bottlenecks efficiently.
Setting Up a Detailed Extended Events Session for CPU Monitoring
To capture comprehensive information about query execution and CPU consumption, we’ll create a detailed Extended Events session. It’s important to note that such a session, especially in a busy environment, can generate a significant amount of data. Therefore, for production systems, consider running it for short durations or applying more restrictive filters. For demonstration purposes, we’ll focus on monitoring a specific database, AdventureWorks, in a test environment.
Here’s the T-SQL script to define an Extended Events session tailored to capture query execution details and CPU usage:
CREATE EVENT SESSION CPUQueryAnalysis ON SERVER
ADD EVENT sqlserver.rpc_completed(WHERE (sqlserver.database_name = N'AdventureWorks')),
ADD EVENT sqlserver.rpc_starting(WHERE (sqlserver.database_name = N'AdventureWorks')),
ADD EVENT sqlserver.sp_statement_completed(WHERE (sqlserver.database_name = N'AdventureWorks')),
ADD EVENT sqlserver.sql_batch_completed(WHERE (sqlserver.database_name = N'AdventureWorks')),
ADD EVENT sqlserver.sql_batch_starting(WHERE (sqlserver.database_name = N'AdventureWorks')),
ADD EVENT sqlserver.sql_statement_completed(SET collect_statement=(1) WHERE (sqlserver.database_name = N'AdventureWorks'))
ADD TARGET package0.event_file(SET filename=N'C:ExEventsCPUQueryAnalysis.xel',max_file_size=(50),max_rollover_files=(5))
WITH (TRACK_CAUSALITY=ON,STARTUP_STATE=OFF);

ALTER EVENT SESSION CPUQueryAnalysis ON SERVER STATE = START;
This session captures the start and completion events for batches and Remote Procedure Calls (RPCs), as well as individual statement completion events within batches and procedures. The collect_statement=1 action ensures that the text of the executed SQL statements is captured. Causality tracking is enabled to facilitate grouping related events, and the output is directed to an event file (CPUQueryAnalysis.xel). Remember to adjust the file path (C:ExEvents) to a suitable location on your server. It is also recommended to limit the max_file_size and max_rollover_files for production environments to manage disk space usage.
Analyzing Extended Events Data to Identify High CPU Queries
Once the Extended Events session is active and capturing data, you can analyze the collected information to find high CPU usage in SQL Server. The most straightforward method is to open the .xel files generated by the session in SQL Server Management Studio (SSMS).
After opening a CPUQueryAnalysis.xel file, the Extended Events viewer in SSMS displays a list of captured events. Initially, it shows a default set of columns.
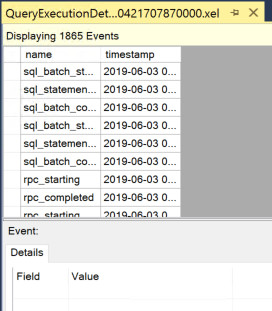 Initial Extended Events Viewer Display
To effectively identify high CPU queries, we need to customize the displayed columns to include cpu_time and other relevant details. Click on the “Choose Columns…” button in the Extended Events viewer toolbar. This will open a dialog box where you can select the columns to display from the available event attributes. Select columns such as cpu_time, duration, statement, batch_text, database_name, username, and server_principal_name.
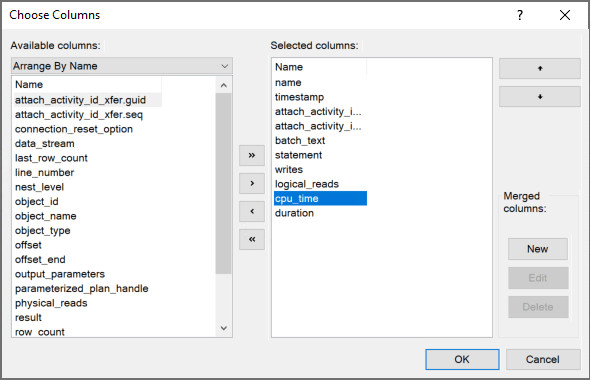 Column Selection in Extended Events Viewer
After selecting the desired columns and clicking “OK”, the data grid in the Extended Events viewer will update to display the chosen columns for each event.
Now, to find high CPU usage in SQL Server, simply sort the events by the cpu_time column in descending order. Clicking on the cpu_time column header once will sort in ascending order; clicking it again will sort in descending order, placing the events with the highest CPU time at the top.
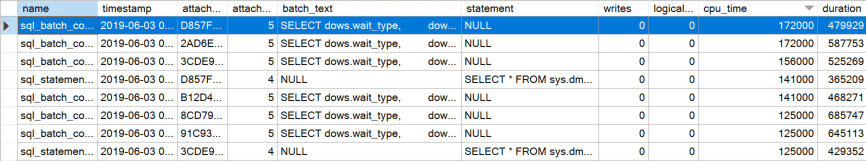 Sorted Extended Events Data by CPU Time
This sorted view immediately reveals the batches and statements that consumed the most CPU during the captured period. You can further refine the analysis by using filters. For instance, to focus solely on individual SQL statements and exclude batch or procedure start/complete events, click the “Filters…” button in the toolbar. In the filter dialog, add a filter for the event_name field to include only sql_statement_completed events.
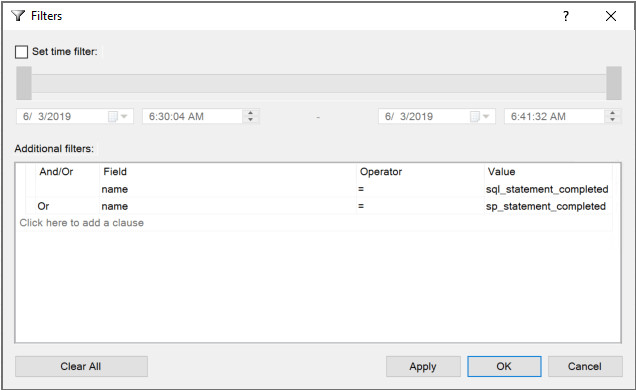 Filtering Extended Events Data to Show Only Statements
Applying this filter will narrow down the view to individual statements, allowing you to pinpoint the exact queries that are contributing most significantly to high CPU usage.
Conclusion: Leverage Extended Events for SQL Server CPU Analysis
Extended Events offer a robust and efficient way to find high CPU usage in SQL Server. By setting up a targeted session and utilizing the features of the Extended Events viewer in SSMS, you can quickly identify the queries responsible for excessive CPU consumption. This detailed insight empowers you to focus your performance tuning efforts on the most impactful areas, leading to improved SQL Server performance and overall system responsiveness. The ability to customize captured data and filter results makes Extended Events an invaluable tool for any SQL Server professional seeking to optimize database performance.